Skip to content
0%DECODING
STATSTRIKE CORE CALIBRATION

Preparing High-Speed Telemetry

CALIBRATING TELEMETRY CORE...

FRAME 000 // 100
CORE STATUS: STREAMING
SYSTEM GEOMETRY
WAGON RADAR 360° // BALLISTIC CORE
0%
NEXT-GEN CRICKET INTELLIGENCE

Every Ball. Every Angle. Deconstructed.

StatStrike fuses high-precision telemetry, Hawkeye pitch dynamics, and 360° wagon-wheel analytics into a unified tactical intelligence core.

Scroll to explode architecture
WORKING SOFTWARE PREFACES // 01 — 08

Inside the Interface: Software Timeline

Authentic screenshots from our active desktop client. Follow the chronological lifecycle of a match from fixture initialization, to live ball-by-ball telemetry ingestion, broadcast video synchronization, and deep tactical analytics.

01
01 // SYSTEM INITIALIZATION
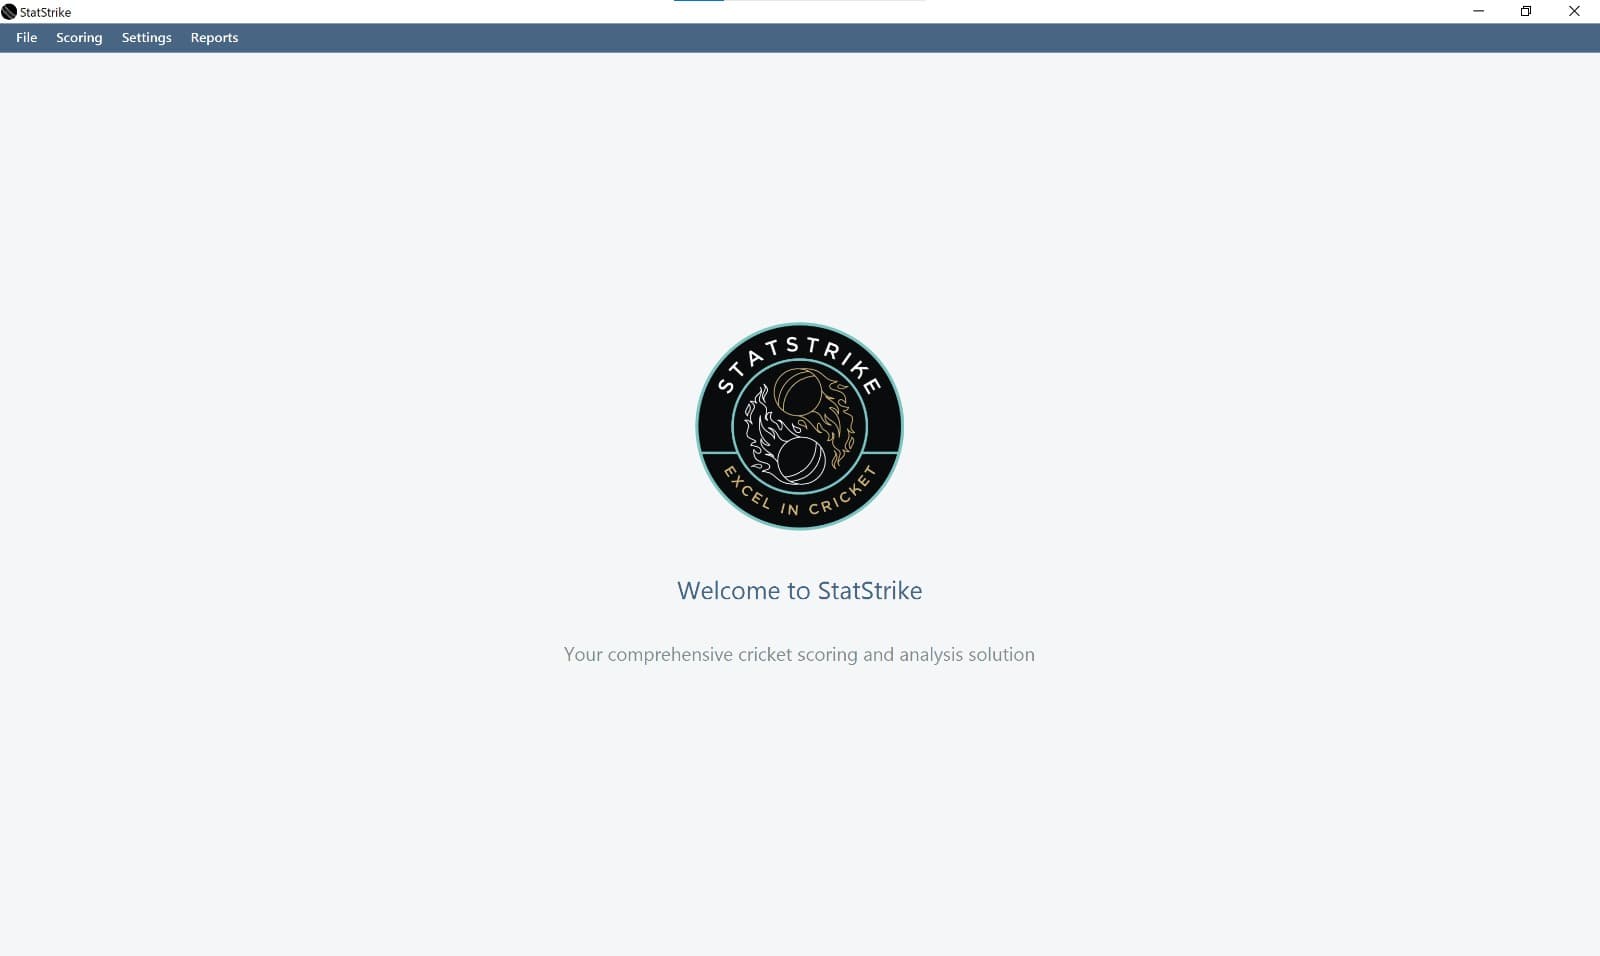
System Launch & Central Architecture Core
SCREENSHOT // 1600 × 956 px
Click to Inspect 1600px 4K View
PREFACE 01 // 08
INSPECT FULL SCREEN ↗
01 // SYSTEM INITIALIZATIONCORE CLIENT LAUNCH

System Launch & Central Architecture Core

The initial entry point of the StatStrike desktop client, engineered for high-performance offline scoring, low-latency database access, and centralized module navigation.

Software Functional Role

The clean, minimalist launch console provides immediate access to the four core software subsystems: File Management, Live Scoring Engine, Hardware & System Settings, and Tactical Analytical Reports. Designed for elite match venues where cloud reliance must be backed by bulletproof local runtime stability.

Key Interface Capabilities
  • Fast cold boot with zero external dependencies
  • Local-first SQLite & telemetry caching architecture
  • Unified top-bar navigation (File, Scoring, Settings, Reports)
  • StatStrike proprietary brand emblem and environment status
DESKTOP RUNTIMELOCAL CACHEMODULE ROOT
02
02 // FIXTURE PROTOCOL
Match Configuration, Officials & Team Rosters
SCREENSHOT // 1600 × 952 px
Click to Inspect 1600px 4K View
PREFACE 02 // 08
INSPECT FULL SCREEN ↗
02 // FIXTURE PROTOCOLMATCH SETUP & ROSTERS

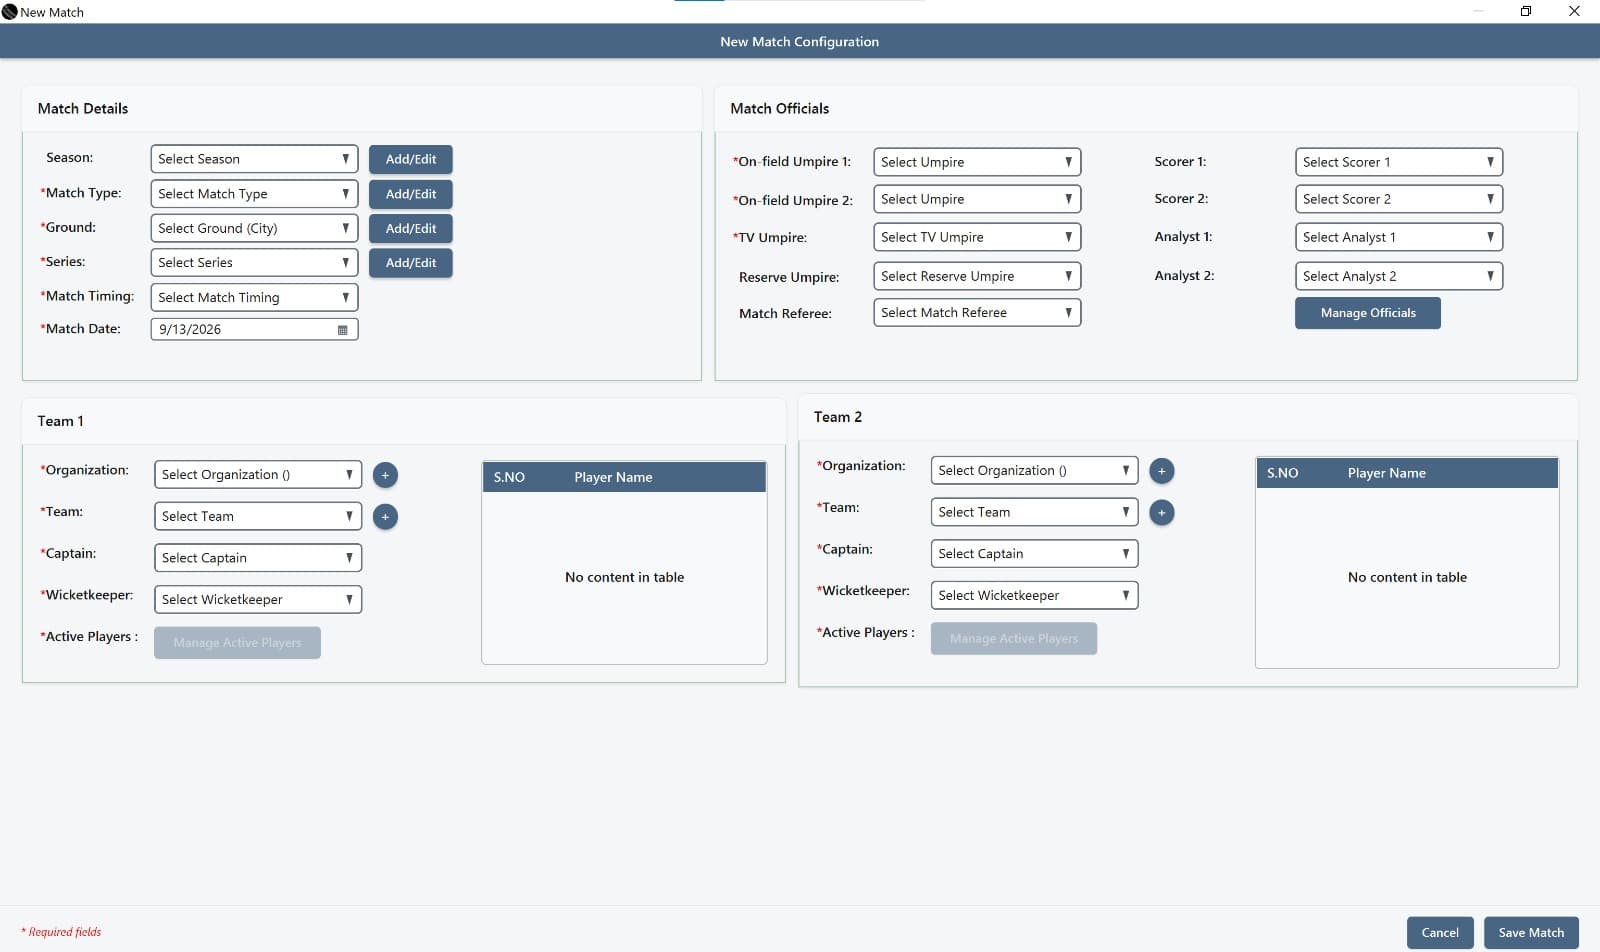
Match Configuration, Officials & Team Rosters

Comprehensive pre-match configuration interface establishing competition parameters, certified match officials, and full playing XI squads.

Software Functional Role

Prior to first ball delivery, operators establish the competition schema including Season, Match Type, Venue/Ground, Series, Timing, and Calendar Date. It enforces official integrity by registering both on-field umpires, TV umpire, reserve umpire, match referee, official scorers, and certified video analysts. Dual team rosters allow instantaneous assignment of captains, wicketkeepers, and active squad members.

Key Interface Capabilities
  • Multi-tiered competition metadata schema with quick modal add/edit
  • Official designation: Umpires, Match Referee, Scorers & Analysts
  • Two-column team roster builder with captain & keeper assignment
  • Roster validation preventing invalid lineup submissions
SQUAD SCHEMAOFFICIAL REGISTRYMATCH INIT
03
03 // BALL INGESTION MATRIX
Granular Ball-by-Ball Telemetry & Spatial Ingestion
SCREENSHOT // 1600 × 957 px
Click to Inspect 1600px 4K View
PREFACE 03 // 08
INSPECT FULL SCREEN ↗
03 // BALL INGESTION MATRIXLIVE TELEMETRY CODING

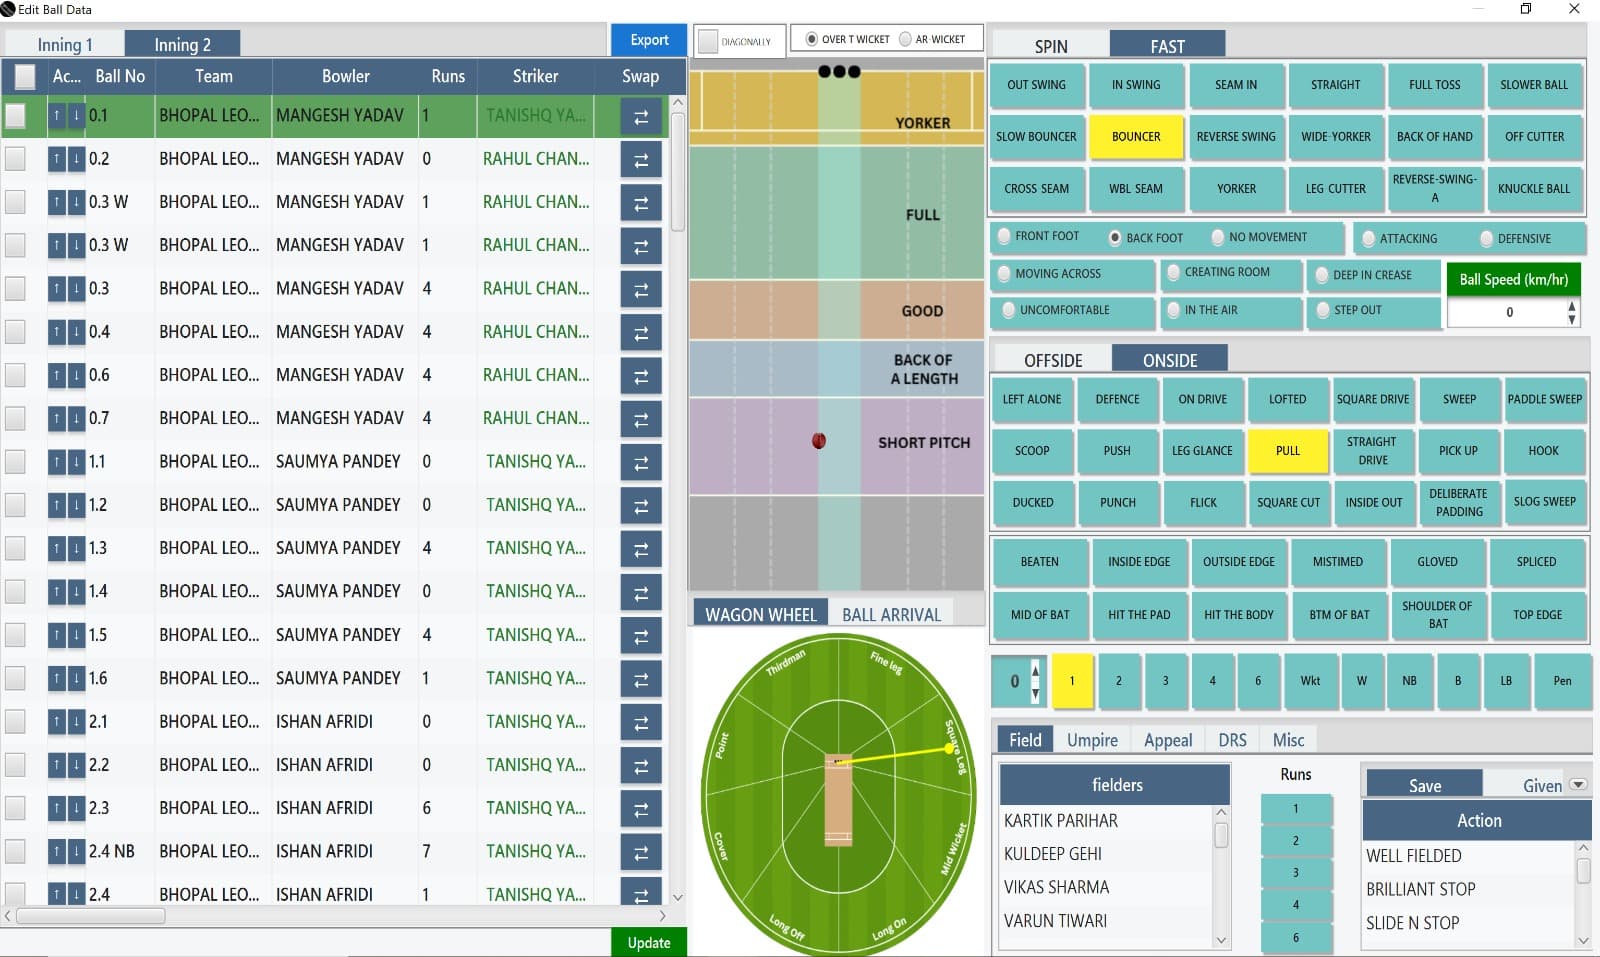
Granular Ball-by-Ball Telemetry & Spatial Ingestion

The high-speed live coding cockpit used by professional match analysts to tag multi-dimensional pitch landing spots, delivery attributes, and batsman mechanics in real time.

Software Functional Role

This dense, ergonomic console allows an analyst to capture a complete delivery in under two seconds. Center stage features an interactive 2D pitch length map (Yorker, Full, Good, Back of a Length, Short Pitch) and a 360° radial wagon wheel with ball arrival trajectory. The right pane provides instant single-click buttons for 19 bowling delivery types (Outswing, Inswing, Reverse, Cutters, Knuckle Ball), batsman footwork/movement, bat contact zones (Mid of bat, Edges, Pad), fielding event loggers, and DRS appeal records.

Key Interface Capabilities
  • Interactive 2D pitch landing coordinate logger with length zones
  • 360° Wagon Wheel radial shot placement vector mapping
  • 19 bowling variations across Spin and Fast classifications
  • Biomechanical batsman footwork tracking and ball speed (km/h) input
  • Bat contact point isolation (Edges, Splice, Mid, Pad, Body)
  • Fielder action log (Well Fielded, Slide N Stop, Brilliant Stop)
1000 FPS LOGGING2D PITCH MAP360° WAGON WHEEL
04
04 // BROADCAST SYNC
Live Match Operations & Synchronized Video Feed
SCREENSHOT // 1600 × 955 px
Click to Inspect 1600px 4K View
PREFACE 04 // 08
INSPECT FULL SCREEN ↗
04 // BROADCAST SYNCLIVE OPERATIONS & VIDEO

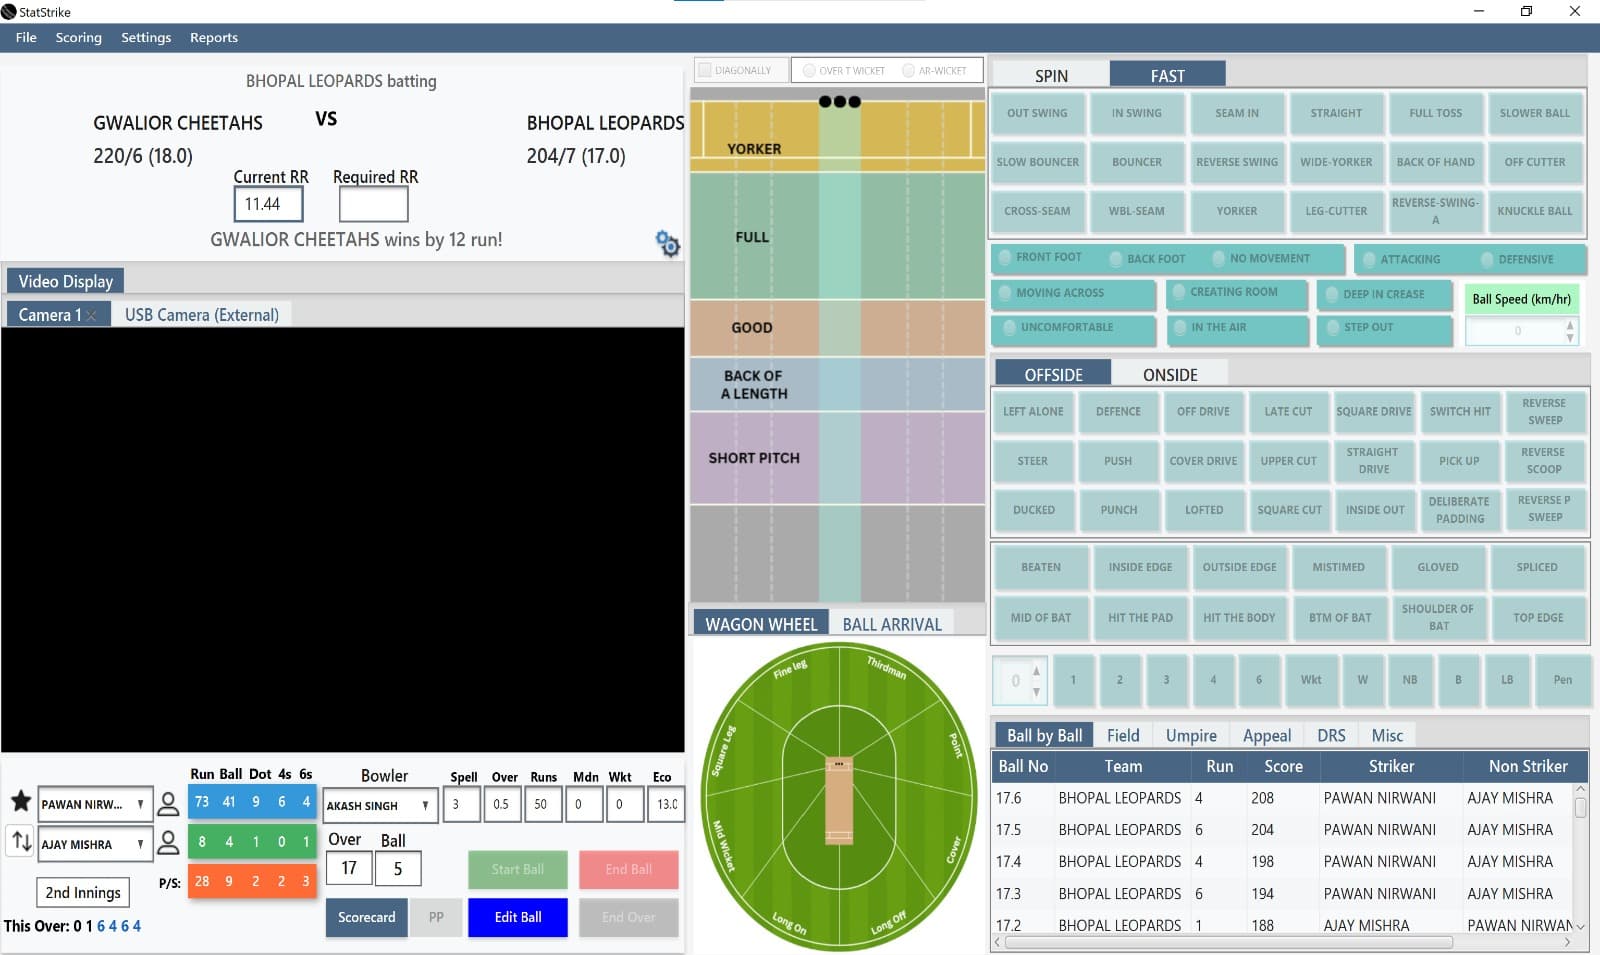
Live Match Operations & Synchronized Video Feed

Mission-critical live match cockpit integrating real-time camera capture feeds with instantaneous ball scoring, over control, and dynamic run rates.

Software Functional Role

Here the live hardware video feed (external high-speed USB/SDI camera) is mapped frame-accurately to the active ball event stream. The operator monitors the live match situation (e.g. Gwalior Cheetahs vs Bhopal Leopards), current run rate, and dynamically updated required run rate. Dedicated controls allow immediate Start Ball, End Ball, Edit Ball, and End Over sequences while logging batsman strike rates, bowler spell figures, and over-by-over progress.

Key Interface Capabilities
  • Direct external hardware camera video display integration
  • Frame-synchronized video timestamping linked to ball events
  • Dynamic Current Run Rate (CRR) & Required Run Rate (RRR) engine
  • Active batter & bowler live scorecard strip with over sequence ticker
  • Instant operator ball controls: Start Ball, End Ball, Edit Ball
CAMERA INGESTFRAME SYNCLIVE SCOREBOARD
05
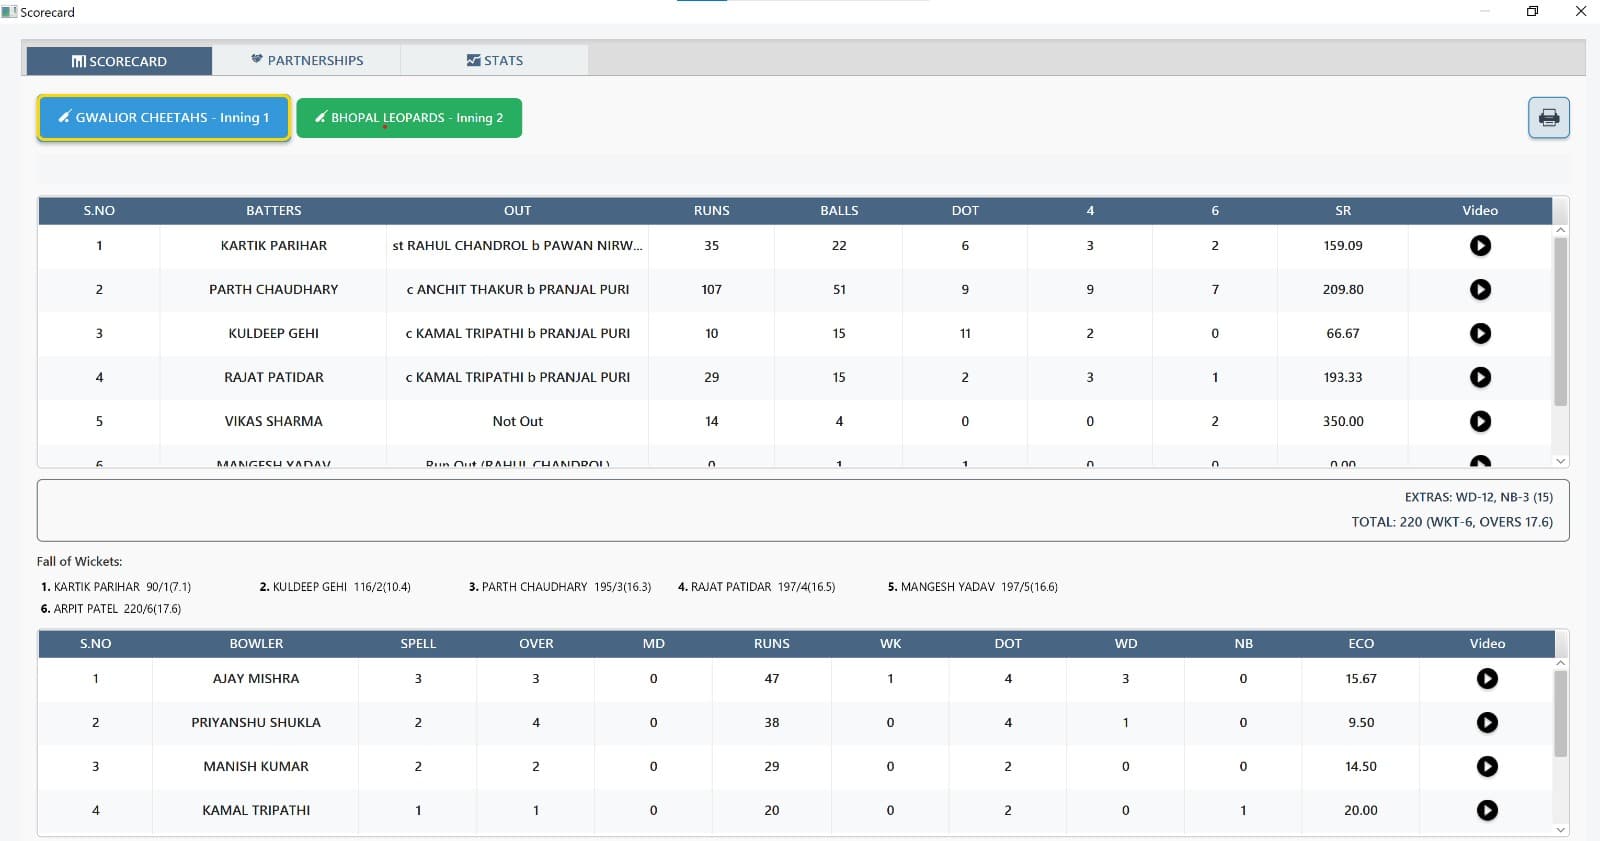
05 // OFFICIAL SCORECARD
Official Inning Scorecard & 1-Click Video Replay Index
SCREENSHOT // 1600 × 841 px
Click to Inspect 1600px 4K View
PREFACE 05 // 08
INSPECT FULL SCREEN ↗
05 // OFFICIAL SCORECARDSCORECARD & VIDEO REELS

Official Inning Scorecard & 1-Click Video Replay Index

Broadcast-grade official inning scorecard tabulating complete batting and bowling figures with embedded one-click video review for every individual player.

Software Functional Role

The comprehensive scorecard module details every batter dismissal, runs, balls, dots, boundaries (4s/6s), and strike rates, alongside complete bowler spell metrics. Critically, each player row incorporates a dedicated video playback button (▶) that automatically compiles and streams every ball faced or bowled by that athlete, eliminating manual video cutting for coaching staff.

Key Interface Capabilities
  • Inning 1 and Inning 2 tabbed scorecards with print/export capabilities
  • Embedded video clip trigger (▶) beside every batsman and bowler entry
  • Sequential Fall of Wickets timeline with exact score and over citations
  • Bowling analysis including maidens, dot balls, economy rate, and extras
1-CLICK VIDEO REELOFFICIAL LEDGERFALL OF WICKETS
06
06 // PLAYER & MATCHUP DIAGNOSTICS
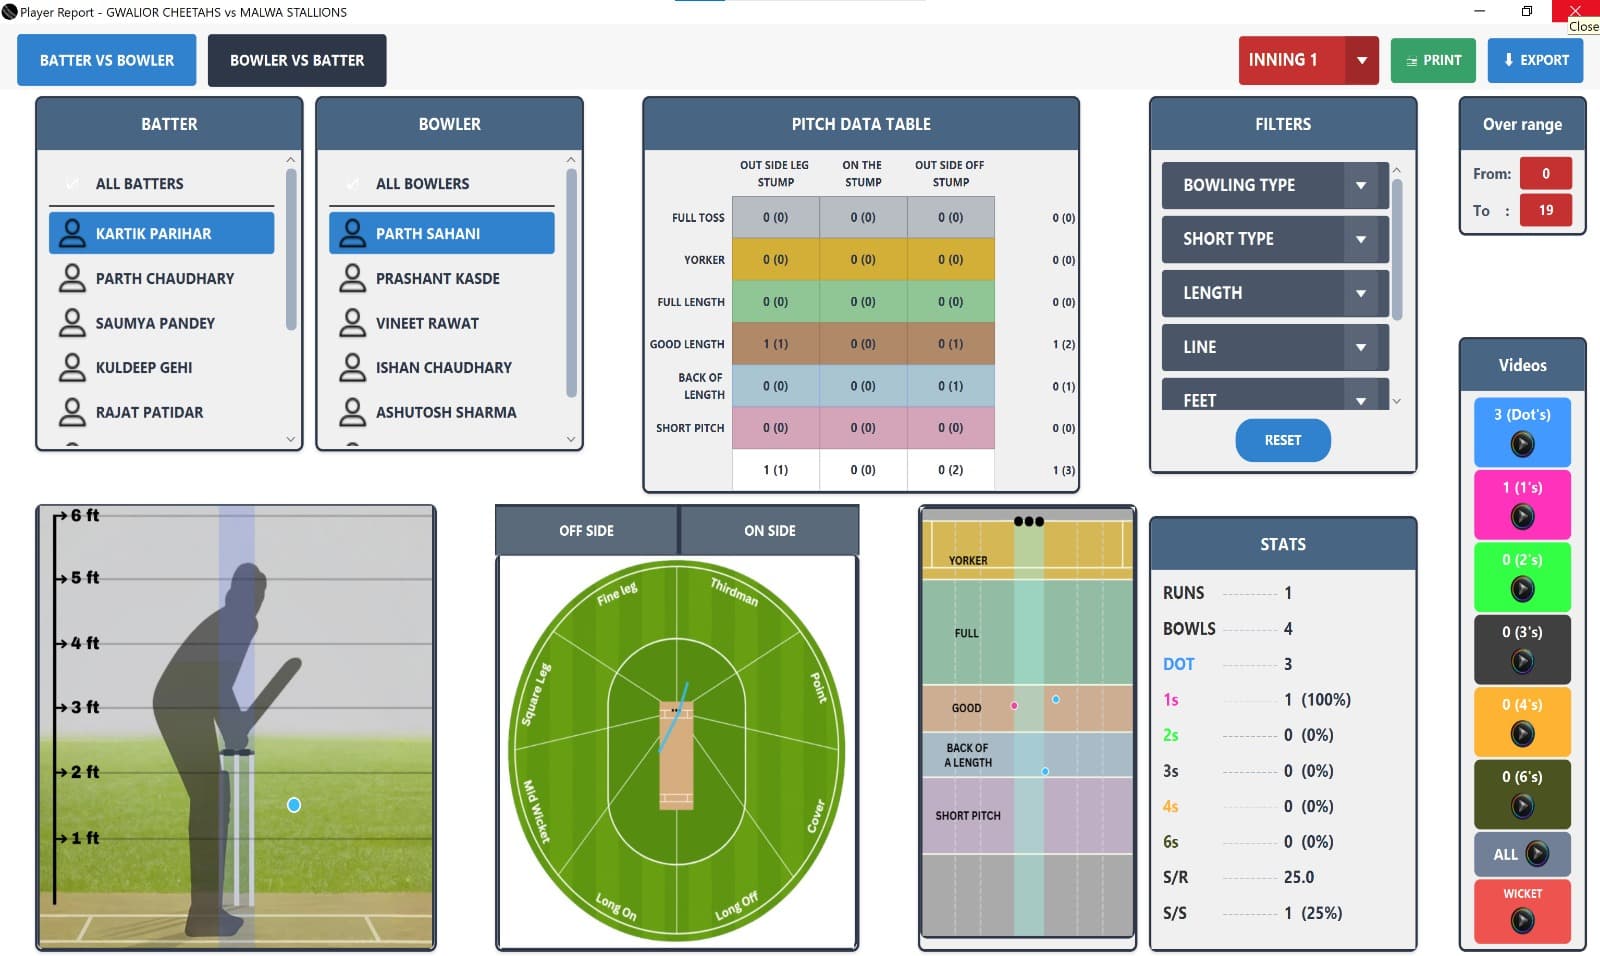
Head-to-Head Player Telemetry & 3D Stance Elevation Matrix
SCREENSHOT // 1600 × 956 px
Click to Inspect 1600px 4K View
PREFACE 06 // 08
INSPECT FULL SCREEN ↗
06 // PLAYER & MATCHUP DIAGNOSTICSBIOMETRIC HUD & ELEVATION

Head-to-Head Player Telemetry & 3D Stance Elevation Matrix

Granular batter vs bowler matchup intelligence featuring a 3D batsman silhouette with ball arrival height, pitch data tables, and filtered video playlists.

Software Functional Role

This diagnostic screen isolates head-to-head tactical battles (e.g. Kartik Parihar vs Parth Sahani). It cross-tabulates a Pitch Data Matrix contrasting Line (Outside Leg, On Stump, Outside Off) against Length (Yorker, Full, Good, Back of Length, Short). Uniquely, it renders a physical 1ft to 6ft batsman silhouette showing exact ball arrival elevation at the crease, coupled with 360° wagon wheel lines, pitch scatter plots, and filtered video playlists by outcome (Dots, 1s, 4s, 6s, Wickets).

Key Interface Capabilities
  • Batter vs Bowler and Bowler vs Batter comparative matchup toggle
  • 6-ft batsman silhouette elevation grid plotting ball arrival height
  • Pitch line & length frequency matrix cross-tabulation
  • Multi-parameter filters: Over range slider (0–19), shot type, feet
  • Instant video reel filters for dots, singles, boundaries, and dismissals
STANCE ELEVATIONLINE-LENGTH MATRIXHEAD-TO-HEAD
07
07 // PARTNERSHIP METRICS
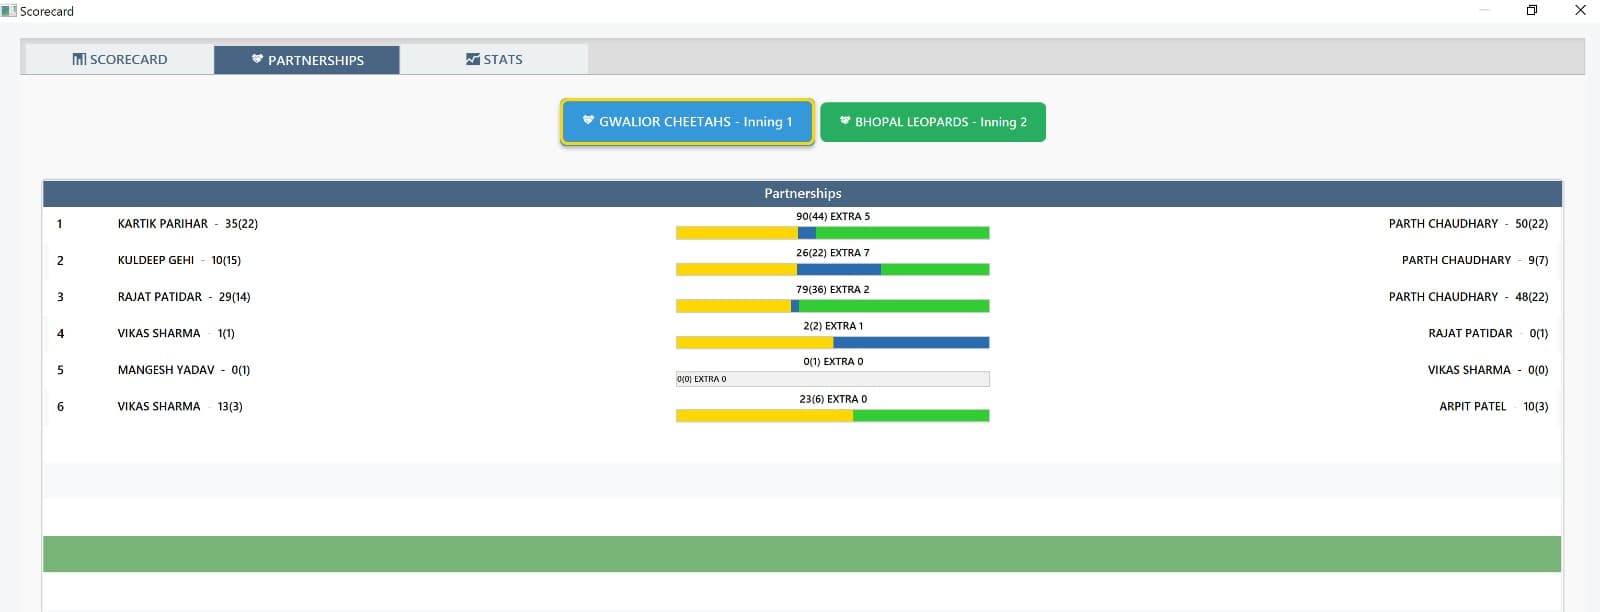
Tactical Partnership Dynamics & Contribution Breakdown
SCREENSHOT // 1600 × 612 px
Click to Inspect 1600px 4K View
PREFACE 07 // 08
INSPECT FULL SCREEN ↗
07 // PARTNERSHIP METRICSPARTNERSHIP DYNAMICS

Tactical Partnership Dynamics & Contribution Breakdown

Visual partnership evaluation mapping wicket-by-wicket scoring contributions, extras conceded, and momentum distribution across both innings.

Software Functional Role

The Partnerships view deconstructs the build-up of every batting stand (e.g. 1st Wicket: 90 runs off 44 balls; 3rd Wicket: 79 runs off 36 balls). Visual horizontal multi-tone proportional bars separate Batter 1 runs (yellow), conceded extras (blue), and Batter 2 runs (green), exposing scoring dominance and strike rotation efficiency during critical match intervals.

Key Interface Capabilities
  • Wicket-by-wicket chronological partnership breakdown
  • Proportional three-tone contribution bars (Batter 1, Extras, Batter 2)
  • Ball counts, individual scoring shares, and partnership run rates
  • Direct comparison toggle between Inning 1 and Inning 2 stands
PARTNERSHIP STACKSRUN CONTRIBUTIONMOMENTUM
08
08 // COMPARATIVE ANALYTICS
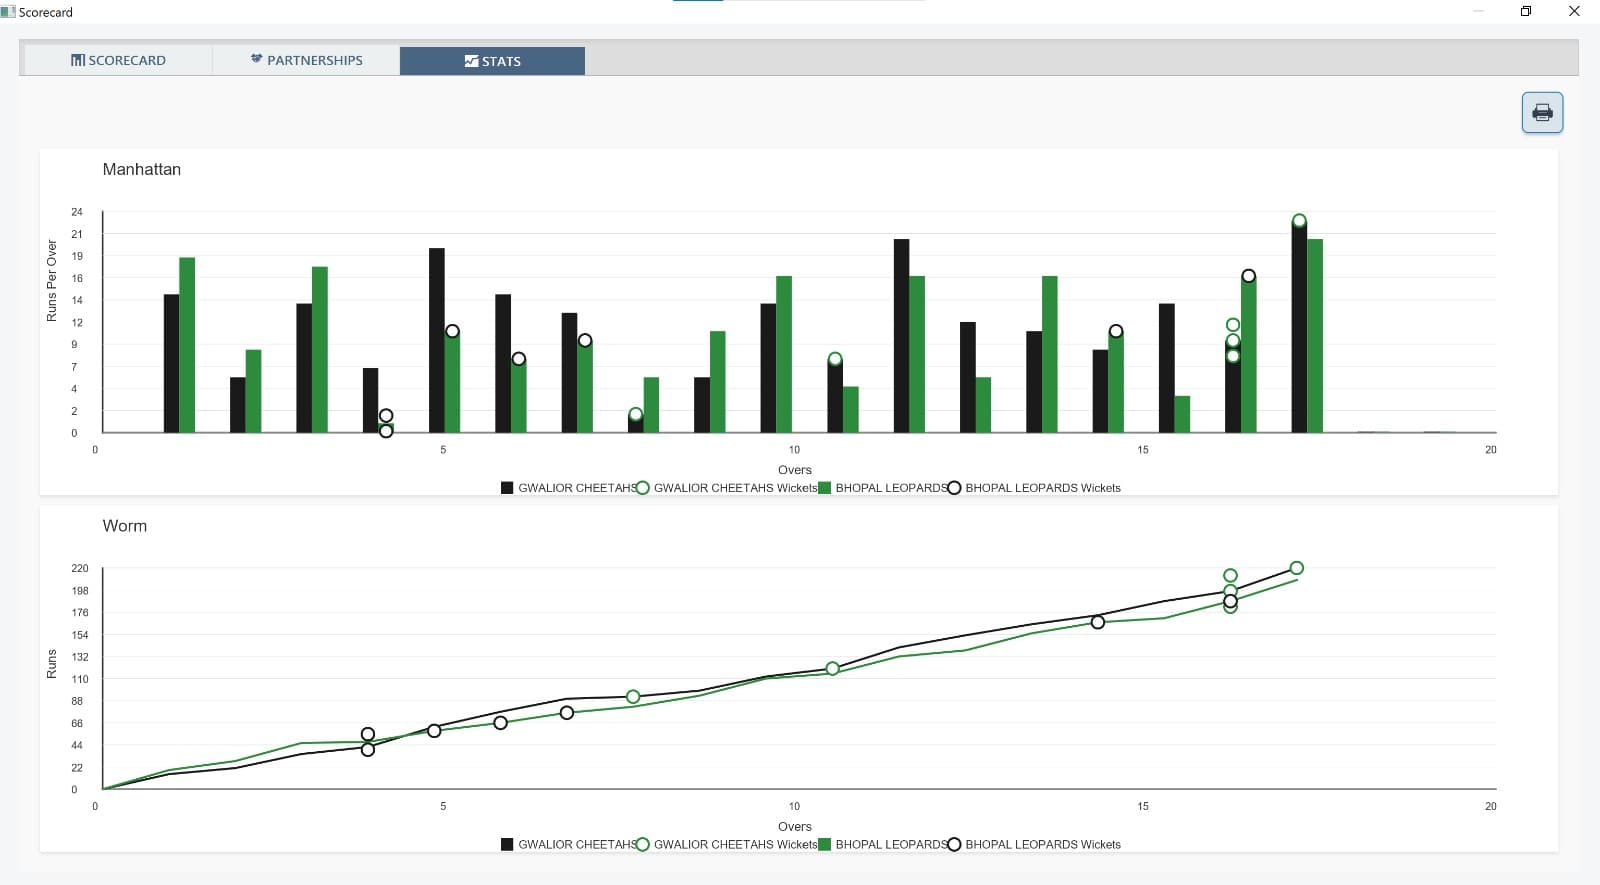
Macro Match Analytics: Manhattan & Worm Trajectories
SCREENSHOT // 1600 × 885 px
Click to Inspect 1600px 4K View
PREFACE 08 // 08
INSPECT FULL SCREEN ↗
08 // COMPARATIVE ANALYTICSMACRO MATCH CHARTS

Macro Match Analytics: Manhattan & Worm Trajectories

High-level macro match visualization providing comparative Manhattan scoring bars and Worm run curves with integrated wicket milestone markers.

Software Functional Role

The final analytical preface visualizes the match macro-narrative across all 20 overs. The Manhattan chart contrasts over-by-over runs scored by both teams, overlaying circular markers for every wicket lost. Directly beneath, the cumulative Worm chart plots comparative run scoring trajectories, illustrating momentum swings, run-rate inflection points, and the precise moment of victory.

Key Interface Capabilities
  • Comparative dual-team Manhattan chart with per-over scoring bars
  • Fall-of-wicket circular badges integrated directly into over bars
  • Continuous Worm curve displaying cumulative run accumulation
  • Export-ready presentation format for post-match team tactical review
MANHATTAN CHARTWORM CURVEMOMENTUM INFLECTION
Problem

Statistics are abundant. Useful answers are not.

Teams often work across scorecards, spreadsheets, video notes, and individual observations. StatStrike is designed to reduce that fragmentation and make important patterns easier to find, discuss, and apply.

Built for the people making sporting decisions
  • Team managementCoordinate decisions with shared evidence and context.
  • CoachesUse structured intelligence in planning and review.
  • Performance analystsSpend less time assembling information and more time interpreting it.
  • Scouts and selectorsReview role-aware evidence for selection conversations.
  • AcademiesTrack development through consistent performance context.
  • Tournament stakeholdersStructure competition-wide data and reporting.
Product identity

Built for cricket decision-makers

StatStrike is designed to structure match, player, team, and competition information so the right questions are easier to ask and discuss.

Evidence first

Public claims stay tied to approved content and visible product states.

Review-ready

Structured views make preparation and selection discussions easier to follow.

Verified live capabilities

Verified live capabilities

Every public feature maps to a verified live feature or qualified status.

No approved live capabilities yet

Approved live capabilities are not published yet. The page remains useful without inventing feature claims.

Request a Demo
How it works

How StatStrike works

01PHASE_INGEST

Structure the data

Organise relevant match, player, team, and competition information.

02PHASE_VALIDATE

Validate the information

Check quality and consistency before interpretation.

03PHASE_MODEL

Identify useful patterns

Analyse questions that matter to the intended decision.

04PHASE_DELIVER

Deliver clear intelligence

Present findings through dashboards, comparisons, and reports.

Approved proof

Approved proof

Use approved screenshots, testimonials, and verified metrics only.

No approved proof is published yet

Approved screenshots, testimonials, metrics, and case studies are not yet ready to publish. The product page remains useful without inventing them.

Request a Demo
Disclaimer

StatStrike supports professional sporting judgement. It does not replace coaching, selection, scouting, medical, or performance expertise.

FAQ

Common questions

StatStrike is designed for teams, coaches, analysts, scouts, selectors, academies, and other cricket decision-makers. The exact setup depends on the organisation and competition.

Next step

Request a demo to review StatStrike for your workflow

Tell us about your organisation, competition, and intended use. We will confirm whether the current approved feature set fits the problem you are trying to solve.

The public page does not imply guaranteed outcomes, and any product fit discussion should be confirmed with the BeSportify team.